The U.S. Bureau of Economic Analysis recently released gross domestic product estimates for the nation’s 366 metropolitan areas. In 2011, metropolitan area growth registered an average of 1.6 percent—just slightly higher than the U.S. total (1.5 percent). However, the growth rate for metro areas dropped noticeably from the 2010 expansion of 3.1 percent.
Only 242 of the nation’s metropolitan areas experienced a 2011 gain in GDP. However, all of Utah’s metro area’s showed increases equal to or greater than the U.S. metro average. Both Ogden/Clearfield and Provo/Orem generated gains of greater than 5 percent. Lowest on the scale proved the Logan metro area with a gain of only 1.6 percent. For more information on the current release, click here.
The housing markets in Utah's most populous counties have endured four challenging years, according to a new report.
Based on five key metrics related to the nation's housing market — average home price, unemployment rate, foreclosure inventory, foreclosure starts and share of distressed sales — the U.S. housing market comes out worse off than it was four years ago, with a several Utah counties hit especially hard.
The 2012 Election Housing Report showed that the average price of a residential property nationwide has decreased 20 percent during the past four years — leaving more than 12 million homeowners owing more than their property is worth, according to RealtyTrac, a market research firm based in Irvine, Calif.
What that numbers don't reflect is the upward trend during the past year in the housing market and the peak periods of foreclosure which kept numbers low during the past few years.
All six Beehive State counties in the report saw unemployment rates nearly double or exceed that amount, from at least 3 percent in 2008 to 6 percent or greater in 2012, while four counties saw the volume of foreclosure starts jump more than double during the period.
But the Utah unemployment rate continues to be better than the national average and the growth in exports also points to an economy on the rebound.
Despite the report's poor numbers, the state's housing market has steadily improved during the past year, and Utah has one of the lowest overall unemployment rates in the country — more than 25 percent below the national rate of 7.8 percent.
Daren Blomquist, vice president of marketing for RealtyTrac, said the foreclosure market is improving nationwide, which bodes well for Utah and most other states.
However, the positives of lower foreclosure inventory and fewer foreclosure starts are outweighed by the negatives of lower home prices, higher unemployment and a higher share of distressed sales, the report stated.
Nationwide, in the 919 counties with data available for all five metrics, 580 (65 percent) showed at least three out of the five key metrics worse off than four years ago, while in 315 counties (35 percent) at least three of the five key metrics were better off than four years ago. Deseret News
At least five Utah school districts plan to vie for millions in federal cash as part of the U.S. Department of Education’s Race to the Top District program.
The Granite, Ogden and Provo school districts plan to seek $20 million to $30 million each; the Morgan County School District will likely apply for $5 million to $10 million; and the Washington County School District plans to apply for $30 million to $40 million, according to the U.S. Department of Education.
The five districts are among 893 nationwide that have submitted letters saying they intend to apply for a chunk of nearly $400 million meant to support reforms aimed at personalizing learning, closing achievement gaps and preparing kids for college and careers.
The department has previously held Race to the Top competitions for states as well. Utah, as a state, applied for a $175 million Race to the Top grant in 2010 but did not win one. Salt Lake Tribune
The U.S. Department of Agriculture on Wednesday declared four more counties in Utah as primary disaster areas because of damage and losses caused by drought and excessive heat, bringing the number of designated counties in the state to 20.
Utah’s remaining nine counties have been declared vulnerable because of their close proximity to primary disaster areas. All qualify for emergency government loans.
The additional disaster areas in Utah are Garfield, Kane, Wasatch and Wayne counties. They are among 39 additional counties in eight states declared as primary natural disaster areas. Salt Lake Tribune
Drive your car over aspen-covered Boulder Mountain in southern Utah or park it in downtown Salt Lake City or on the Brigham Young University campus in Provo and you can expect something to happen.
The recent request by the Drug Enforcement Administration (DEA) to mount license plate scanners on Interstate 15 in southwestern Utah met opposition, but law enforcement across the state, including police at BYU, are already using license plate scanners to find everyone from parking scofflaws to violent crime suspects.
Even before the DEA request, southwestern Utah had a concentration of license plate scanners.
The St. George Police Department has its own scanner, while other police forces in that county are on a list of agencies that can borrow a car from the Utah State Tax Commission equipped with scanners. The drug task force that covers Iron and Garfield counties also has a license plate scanner it has used to build cases against people suspected of growing marijuana on public lands.
A Salt Lake Tribune review identified 47 police departments and county sheriffs who use license plate scanners or have permission to borrow the Tax Commission scanner cars. Statewide agencies, including the Utah Highway Patrol, also use the scanners. Salt Lake Tribune
The Census Bureau has recently released county-level population estimates for 2011. Of course, the operative word here is "estimates." Actual counting only occurs once every ten years.
As you can see from the visualization below, tiny Daggett County displayed the largest 2011growth rate (using the July 1 estimates), but added less than 100 individuals. The second fastest growing counties were neighbors--Summit and Wasatch counties. Despite its late entry to the economic recovery, Washington County managed the fourth-fastest population growth rate.
Six counties registered population declines--Emery. Carbon, Garfield, Piute, and Beaver. Interestingly, these counties form a little cluster of contracting population near the center of Utah.
You can access the Census Bureau's 2011 estimates by clicking here. The Utah Population Estimates Committee should also release their 2011 population figures in the near future.
Provo-Orem, Heber City and St. George — and, to a lesser extent, Salt Lake County — were among the fastest-growing places in the nation in 2011, according to new estimates from the U.S. Census Bureau. But not everywhere in Utah is booming. Estimates also showed that rural Beaver, Carbon, Emery, Garfield, Piute and Wayne counties all lost population last year. Salt Lake Tribune
The Heber City micropolitan area, for example, grew by 3.8 percent — or four times faster than the national rate. That made Heber the seventh fastest-growing such area in the nation.
Meanwhile, the Provo-Orem metropolitan area grew by 2.7 percent, or three times the national average. It also finished as the nation’s seventh fastest-growing metropolitan area.
Metro St. George landed at No. 11 out of 366 metropolitan areas nationally with 2.6 percent growth. Metro Salt Lake City was No. 40 at 1.9 percent. Logan was No. 64 at 1.7 percent. Ogden-Clearfield was No. 77 at 1.6 percent.
Women in Provo have some of the lowest average salaries in the country, according to a Forbes analysis of the 2010 American Community Survey by the U.S. Census Bureau. Provo women are making on average less than $37,000 a year, according to the report. Provo women are making on average less than $37,000 a year, according to the report. Deseret News
Note: Since I am interested in women's labor force issues and don't usually look at this type of data below the statewide level, I took the opportunity to look at the actual Forbes article. Forbes used 2010 American Community Survey data for "large" Metropolitan Statistical Areas (MSAs) and focused on females working year-round and full-time. Unfortunately for comparative purposes, Forbes doesn't tell us what they considered a large MSA.
With median female earnings for year-round, full-time workers of $31,400, the Provo/Orem MSA ranks 249 out of 374 MSAs nationwide. Incidentally, the "smaller" MSAs of Logan and St. George showed lower female median earnings ($27,100 and $26,700, respectively). Other large Utah MSAs appear higher in the rankings--Salt Lake ranks 154, while the Ogden/Clearfield MSA ranks in the 200 spot.
However, keep in mind that areas with low female earnings might also have low earnings for both genders. In other words, an MSA's low female earnings may be reflected in low male earnings as well. Cost of living, age of the labor force, industrial mix, etc. affects wages generally. . .not just for women. In my mind, the true question perhaps should be: How do men and women's earnings compare in Utah's most populous communities?
In 2010, U.S. median earnings for women working year-round, full-time measured 78.6 percent of the comparable male figure. (This wage gap has contracted decidedly in recent decades.) How do Utah's MSAs stack up? Honestly, not so great. The Ogden/Clearfield MSA shows a female/male wage ratio of 63 percent, the Provo/Orem MSA shows 65 percent ratio. Logan's ratio measures 70 percent, and St. George's figure is 71 percent. Even in Utah's best MSA performer--Salt Lake City--the female median wage measures only 74 percent of the male median wage. More than 70 percent of the nation's MSAs show female/male wage ratios better than Salt Lake City.
What's up? Why the low female-to-male wage rations in Utah? Undoubtedly many factors come into play. However, one major influence on the large difference in wages seems to come to the forefront. I call it the "education gap" and it is a primary factor behind Utah's larger-than-average wage gap. Statistically, there is a well-know relationship behind one's earnings and one's education. In general, the higher a person's level of education, the higher their earnings.
What's the education gap? By my reckoning, it is simply the percentage point difference between the share of the male population (over 25) with at least a Bachelor's degree and the share of the female population (over 25) with at least a Bachelor's degree. Nationally, there is a six-tenths of a point difference in the share of men and women with at least a Bachelor's degree (28.5 percent and 27.9 percent, respectively). In other words, in the U.S. there is currently very little difference between the share of men and women with a four-year degree or better.
The three MSAs with the largest male/female education gap in the nation? Number 1--Provo/Orem, Utah (11.3 percentage points). Neck and Neck for the number 2 spot--St. George, Utah (9.8 percentage points) and Ogden/Clearfield, UT (9.8 percentage points). Logan's performance is somewhat better--"only" a 4.2 point difference. The Salt Lake MSA managed the smallest Utah education gap--still large at 2.5 percentage points. Every single Utah MSA ranked among the 20 percent of MSAs with the largest education gaps.
Keep in mind that in 40 percent of the nation's Metropolitan Statistical Areas, a higher percentage of women have obtained a Bachelor's degree than have men. If Utah's women are falling far behind men in educational attainment, it should come as no surprise that they are falling far behind men in earnings.
Utah occupancy and average daily room rate for hotels and motels were both up slightly in 2011. According to the Utah edition of the Rocky Mountain Lodging Report, the 2011 occupancy rate was 62.7 percent, up from 59.7 percent in 2010.
The average daily room rate for the year to date was $95.69, compared to $93.29 for 2010. Revenue per daily room rose as well, from $55.70 in 2010 compared to $60.04 for 2011. Salt Lake City recorded the best in 2011, with a 69.6 percent occupancy rate and average daily room rate of $93.65.
.
Ogden occupancy was at 60.7 percent, Cedar City at 53 percent, St. George at 60.1 percent, Logan and Utah County at 58.1 percent, and other Utah cities and towns at 61.2 percent. Salt Lake Tribune
The Milken Institute, founded in 1991 and based in California, has released a new list of best performing cities for the year. Salt Lake City, Provo and Ogden ranked in the Top 25 among large metro cities, while Logan ranked No. 1 among small cities. Logan skyrocketed from its No. 19 ranking in last year's list.
The research looked at 179 small cities and 200 large metros. In the large-city category, Salt Lake was ranked No. 6, Provo was listed at No. 9, and Ogden took the 15th spot on the list. St. George, which falls in the small-city category, was ranked 124th. No other Utah cities made the list. Herald Journal
Utah home sales rose for the fifth straight month in October — up nearly 25 percent from last year, according to a new report from the Utah Association of Realtors. During the month, Utah Realtors sold 2,819 homes, townhomes and condos compared to 2,261 sales last year. It was the fourth consecutive month of double-digit sales increase. Since the beginning of the year, Utah home sales are up over 7 percent compared to the same 10-month period in 2010.
The month's inventory in Uintah County is 4.6 months and prices are up nearly 14 percent, a release states. Similarly, in Washington County, the month's supply is 6.5 months and the median price has increased about 11 percent from last October. Statewide, the number of homes on the market has come down more than 21 percent over the past year — the fewest amount of homes on the market since mid-2007 and the eighth consecutive month of double-digit declines. In October, the median price of homes sold in Utah was $174,750, down 3.6 percent compared to the same period last year.
In addition to Uintah and Washington counties, several other areas saw increasing prices, including Emery, Grand, Juab, Morgan and San Juan counties. The median price in Weber County stayed nearly the same, coming in at $139,500 compared to $137,990 last October. Deseret News
Statewide, enrollment in districts and charter schools grew by nearly 2 percent or 11,500 students this year over last, coming in below projected estimates that enrollment could increase by more than 14,700 students. According to the new numbers, 587,745 students now fill Utah’s public school classrooms.
Of all the districts in the state, Alpine saw the biggest enrollment leap. Much of the increase in Alpine is a result of growth in a number of its communities, including Saratoga Springs, Eagle Mountain and Lehi. Over the past 10 years, Alpine has built 19 new schools, and plans to build another six in coming years, thanks to a $210 million bond voters approved last month. Alpine now has 79 schools.
The Davis district grew by 1,665 students this school year. And Jordan, Washington, Provo, and Nebo districts saw significant increases as well, among others. But charter schools, as a group, experienced the largest growth. Enrollment at Utah’s 78 charter schools swelled to 44,892 students, an increase of 4,760 bodies, meaning about 7.6 percent of all public school students now attend charter schools, up from about 7 percent last year. Charter schools are independently run public schools. Salt Lake Tribune
Roberts Arts and Crafts will be closing its stores come January. Representatives of the craft store, which first opened in Provo in 1963, announced on Wednesday that they will be closing all the Roberts stores -- located in American Fork, Orem, Provo, South Jordan and Washington -- to focus on online sales. A company representative wouldn't comment on how many employees will lose their jobs. Daily Herald
This week, U.S. Secretary of Labor Hilda Solis and Martha Kanter, undersecretary of education, announced nearly $500 million will be given to community colleges across the nation in order to better provide training and workforce development. Among those recipients, Utah will receive $2.7 million over the next three years. The funds will be distributed among Salt Lake Community College, Snow College, Dixie State College, Utah Valley University, Weber State University and the Utah College of Applied Technology. Deseret News
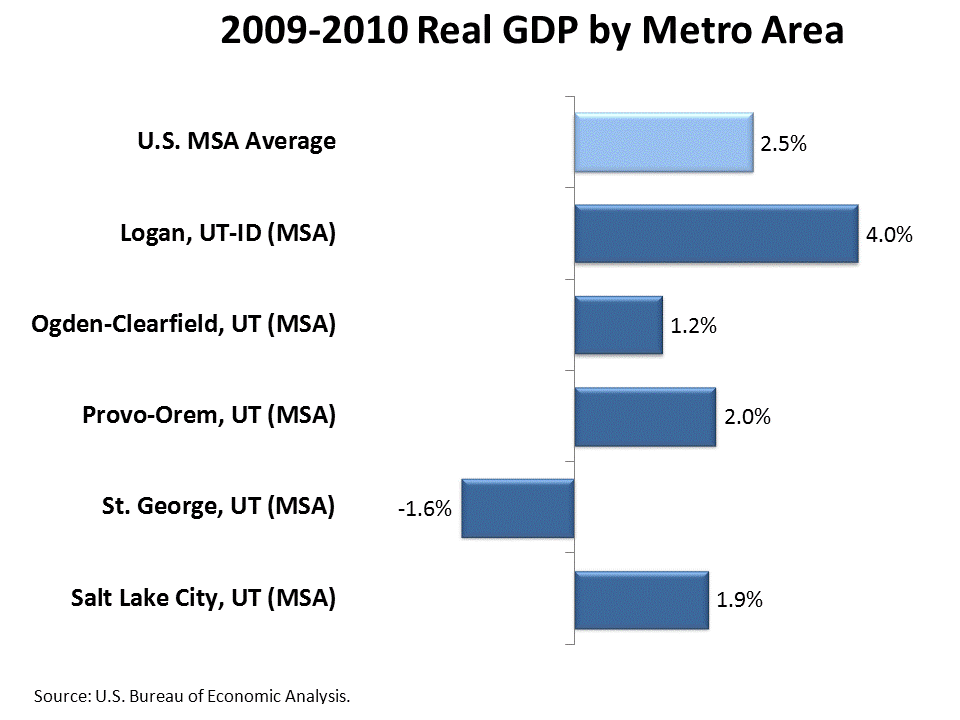
The U.S. Bureau of Economic Analysis just released annual Gross Domestic Product (GDP) estimates for Metropolitan Statistical Areas (MSAs) today. Remember that GDP represents the value of all goods and services produced in an area. Real (inflation-adjusted) U.S. GDP for metropolitan area increased an average 2.5 percent in 2010 after declining 2.5 percent in 2009. Growth proved widespread with real GDP increasing in 304 of 366 (83 percent) metropolitan areas, led by national growth in durable-goods manufacturing, trade, and financial activities.
In Utah, growth also dominated the figures with only the St. George, UT MSA displaying an annual decline in real GDP (down 1.6 percent). In general, GDP growth in Utah's MSAs registered below average. The Logan UT, MSA showed the most rapid expansion (4.0 percent).
For more information about the 2010 GDP figures for MSAs, click here.
U.S. Transportation Secretary Ray LaHood announced this week $12.6 million in grants to Utah. Among grants were $1.74 million for four miles of safety shoulders for bicyclists in Little Cottonwood Canyon and installation of avalanche-control systems there, along with $500,000 for three miles of safety shoulders for bicyclists in neighboring Big Cottonwood Canyon. Also, $1.63 million was awarded for the Provo Intermodal Center; $3.75 million for rehabilitation of Interstate 80 from Wanship to Coalville; $1 million for improvements to an Interstate 84 bridge over the Echo Frontage Road; and $963,673 to help build a rest area at Lion’s Park Scenic Byway near Moab.
Other projects receiving money include $480,000 for safety upgrades and parking facilities along Scenic Byway 12 in Garfield and Wayne counties; $465,540 for construction of Midblock Road in Holladay between Laney Avenue and the Murray-Holladay Road; and $150,000 to replace an obsolete bridge on State Road 39 over Beaver Creek east of Huntsville. Salt Lake Tribune
The U.S. Bureau of Economic Analysis (BEA) has just released 2010 total personal income estimates for U.S. Metropolitan Statistical Areas (MSAs). According to BEA, personal income rose in 2010 in all but four of the nation’s 366 metropolitan statistical areas. Fortunately, none of Utah's five MSAs ranked among those with declining personal income. On the other hand, some MSAs performed far better than others. Overall, personal income in the U.S. increased 2.9 percent between 2009 and 2010. Here's a few highlights of the MSA stats:
Logan, UT-ID MSA--Personal income in this MSA totaled $3.4 billion in 2010, an increase of 4.1 percent from the previous year. This ranked this MSA 53rd in terms of growth--the highest of any Utah area. This area also showed the highest gains in net earnings--3.4 percent.
Ogden-Clearfield, UT MSA-- In 2010, personal income in this MSA reached $18.2 billion reflecting a 2.7 percent gain over 2009. This MSA showed the third highest growth in personal income among Utah MSAs and ranked 197 (out of 366 MSAs) nationally.
Provo-Orem, UT MSA--With total personal income expansion of 2.8 percent, this MSA tied for second in the Utah ranking and 179 nationally in terms of 2010 growth. During 2010, total personal income measured roughly $13.4 billion.
St. George, UT MSA--This MSA showed the worst growth performance in the state. Between 2009 and 2010, personal income increased only 1.5 percent to equal $3.6 billion. Still suffering from the economic downturn, net earnings in this MSA dropped by 1.1 percent--the only decline among the Utah MSAs. Nationally, St. George ranked 344 for percent growth nationally.
Salt Lake City, UT MSA--Utah's most populous MSA experienced a 2.8 percent increase in total personal income during 2010. That places Salt Lake City in the number 176 spot for growth among MSAs nationwide. Here, total personal income is estimated at $43.6 billion.
For the complete release on personal income from the Bureau of Economic Analysis, click here.
Utah will receive federal aid to pay for this spring’s flood damage. President Barack Obama signed a Utah disaster declaration and ordered federal funds to supplement the recovery effort from flooding between April 18 and July 16.
The funds are available to state, tribal and eligible local governments, and certain private nonprofit organizations, on a cost-sharing basis for emergency work and repair or replacement of facilities damaged by the flooding in the counties of Beaver, Box Elder, Cache, Daggett, Duchesne, Emery, Millard, Morgan, Piute, Salt Lake, Sanpete, Sevier, Summit, Tooele, Uintah, Utah, Wasatch and Weber, and the Uintah and Ouray Indian Reservation. The state could be eligible for $9.5 million in federal aid. Salt Lake Tribune
Housing bubbles aren't like most price bubbles. Typically, speculation drives up prices (of stocks, crude oil, and back in the 17th century even tulips) like an expanding bubble. Eventually, it becomes obvious that item is extremely over-valued and prices "pop" and collapse. Yes, that's why we call them bubbles.
Remember a couple of years ago when gasoline prices went through the roof? You can blame a bubble market in crude oil. (Some SEC reports indicated that 80 percent of crude oil trading during the height of that price expansion was speculative.) In just seven months, the producer price index (seasonally adjusted) for crude oil went from 339.9 to 108.8. That change represents a decrease of almost 70 percent! Talk about a popping bubble. (And, you might want to note the similarity to the current price increases in oil/gasoline.)
On the other hand, housing bubbles tend to slowly deflate rather than pop. Why? Think about it. If you bought a home at the height of the bubble for $400,000 do you really want to sell it for $250,000? No. Most private individuals aren't able to afford that kind of loss. For many American families, a home is their largest asset. So, if you must sell, you will keep trying to sell at a higher price until the market makes it clear that just isn't going to happen. In other words, home prices are sticky downward, so it will take longer for home prices to deflate after the speculation ends.
It also becomes readily apparent why there is such a foreclosure mess in this country. Obviously, many home-buyers took out loans they couldn't afford in the long run. Then, the recession exacerbated other home-buyers' ability to pay. In addition, even if home-buyers can afford to make their payments, aren't the incentives skewed towards walking away rather than paying off the $400,000 mortgage on a home that is now worth only $250,000?
Well, this housing bubble has certainly taken its time collapsing. However, the market is working her magic and there does seem to be light at the end of the tunnel--at least according to the Federal Housing Finance Agency's Housing Price Index (HPI). (For more information on the HPI see this previous post or the Agency's website.)
(Click on image to enlarge.)
The chart that accompanies this posting certainly provides a lovely portrait of a housing market bubble for Utah's Metropolitan Statistical Areas (MSAs)--particularly for my own Washington County. You can watch home prices explode and then collapse (the chart shows the percent change compared with the same quarter a year ago--which eliminates seasonality).
The Logan, UT MSA (Cache County) seemed to participate the least in the run up of home prices and also appears closest to the end of the price declines. As of fourth quarter 2010 (the most recent index available):
Logan home prices are down only 1.0 percent compared with prices in fourth quarter 2009.
Ogden-Clearfield MSA home prices are down 1.8 percent.
Salt Lake City MSA prices are down 2.0 percent.
Provo-Orem MSA prices are down 2.4 percent.
St. George MSA prices still show the largest price declines--4.8 percent.
However, for all MSA the price declines are getting smaller and smaller. The market is making her adjustments. In fact, given current trends, most if not all of Utah's MSAs are poised to see the end of home price declines in 2011.