
In 1791, President George Washington began correspondence with Arthur Young, an Englishman who desired to understand what agriculture in America looked like. In an attempt to address his questions, Washington administered a farm survey and computed the results for the populated East Coast. Supported by his findings, the President sent a series of letters to Young addressing issues of crop yields, livestock, labor cost, and labor productivity.
Washington’s survey provided a basis for agricultural measurement that continued for decades until 1840, when the first comprehensive Census of Agriculture was administered. Originally conducted as a part of the decennial population census, the Census of Agriculture eventually evolved to operate and release census data every five years, and does so to this day. Despite the variance in methodology and collection of agricultural data since Washington’s day, the fundamental question he sought to answer is still relevant.
In the spirit of Arthur Young, we may then ask the question, “What does the agricultural economy in the Mountainland Region look like?”
The most recent Census of Agriculture, which utilizes data from 2012, illustrates the agricultural economy in the region. Beyond the scope of crop and livestock production, the Census of Agriculture contains massive amounts of data, ranging from internet access on farms to the number of pickup trucks used for agricultural purposes. A distillation of highlights from this census follows:
Agricultural Labor
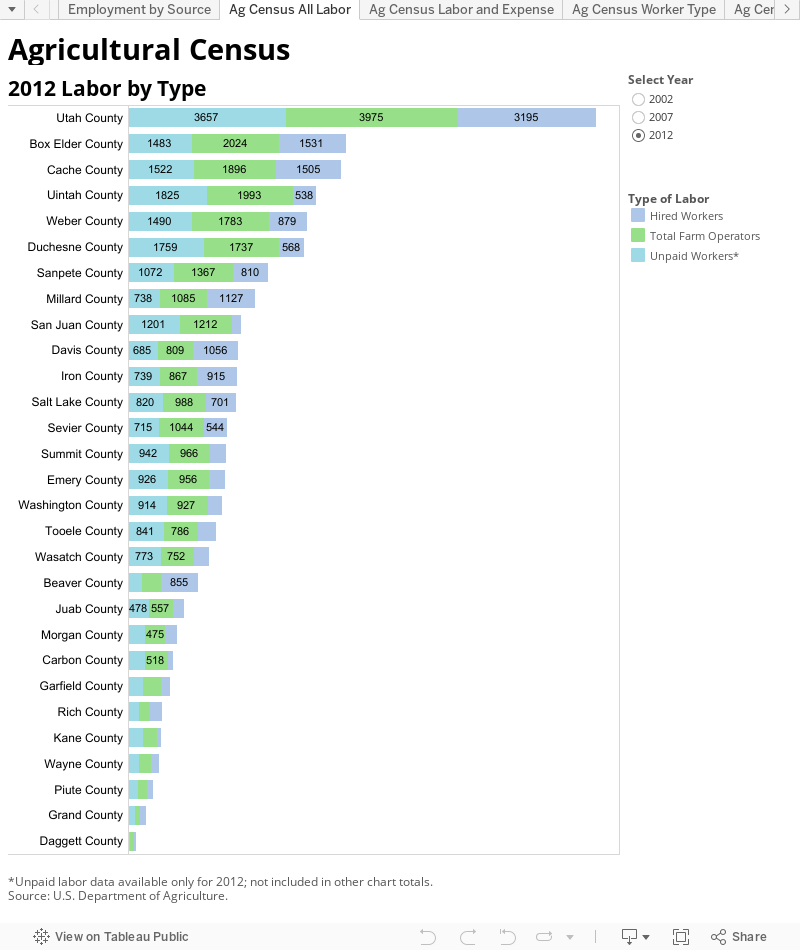
• In 2012, the Mountainland Region reported 4,148 workers in the category of hired farm labor. This represents nearly one-quarter of all hired farm labor in the State of Utah.
• The total reported payroll for hired labor jobs in the region was $38.9 million dollars in 2012.
• The majority of farms using hired labor are smaller operations. Of the 786 farms utilizing hired labor, 78 percent employ one to four hired workers.
• In addition to employees classified as hired labor, there were 6,250 total operators* in 2012.
• Of the 10,398 total workers classified as hired labor and operators, 69 percent work in Utah County. Hired labor and operator counts represent a 4.7 percent increase from 2007 and a 22.6 percent increase relative to 2002.
• Expense per hired worker (calculated by dividing hired labor expense into quantity of hired workers) outpaced inflation and increased from $7,708 in 2007 to $9,378 in 2012.
• Unpaid labor also accounted for 5,850 workers in 2012.
Farms and Land
• The number of farms increased 8.7 percent between 2007 and 2012, for a total of 3,883 farms. Of this total, 2,462 or 63.4 percent are located in Utah County.
• Total acres of land used for agriculture decreased by 7.5 percent in the five years preceding 2012.
• Decrease in farm acreage combined with an increase in the quantity of farms led to a 15 percent reduction in the average size of each farm in the region. However, Wasatch County bucked the trend and nearly doubled agricultural acreage and average farm size during the same period.
• According to tax filings, 81 percent of all farms in the area are classified as family or individually owned.
Agricultural Sales
• Total farm sales increased 22.3 percent relative to 2007, for total sales of $287 million in 2012. Utah County accounted for nearly three quarters of these sales at $222.6 million.
• The area experienced a nominal 111.7 percent increase in the total value of agricultural products sold directly to individuals from 2007 to 2012, perhaps driven by growth trends in farmer’s markets and local food popularity.
• Crop sales accounted for two-fifths of the 2012 agricultural related sales. For the region, these sales were up 44.8 percent over the same five years, from $80.1 million in 2007 to $116 million in 2012.
• Production of hay fell 7.4 percent between 2007 and 2012 to a total of 261,631 tons. Wheat production also decreased in the same period by 32.6 percent to 566,896 bushels. Conversely, corn production increased by 2 percent for a total of 616,606 bushels.
• 2012 total sales of livestock, poultry and related products were up 10.6 percent from 2007, a nominal increase from $154.8 million to $171.2 million.
• The largest livestock markets in the Mountainland counties are cattle, sheep, and horses. In 2012, the Mountainland Region reported a total inventory of 98,644 cattle, 59,751 sheep and lambs, and 12,985 horses and ponies.
As reflected in the aforementioned economic indicators, the 2012 census illustrates the agricultural economy of the Mountainland Region. From jobs to quantity of farms, many dimensions of the agricultural economy witnessed growth between 2007 and 2012. Total farm sales also indicated expansion in the agricultural economy, as sales outpaced inflation and grew at a healthy rate. In contrast, production of wheat, hay, and acreage per farm saw reductions since 2007.
*Operators, serve as farm managers and make “day-to-day decisions about…planting, harvesting, feeding and marketing.”
Sources: 2012 Census of Agriculture, Oklahoma State Extension, USDA NASS History
Visuals: Lecia Langston & Matt Schroeder